Our ‘Hierarchical Boosting’ Hub Track represents a genome-wide scan of positive selection in three continental populations (CEU, CHB and YRI) from The 1000 Genomes Project – Phase 1 release. For each population analyzed, there are four UCSC tracks representing each one of the composite scores: Complete (as red), Incomplete (as orange), Recent (as blue), and Ancient (as violet) boosting scores. Each track has its own significance threshold (set up at 1% false positive rate) which indicates when a signal can be considered significant. Due to the hierarchical nature of the method, the Incomplete boosting function is never applied when a region is significant for a Complete score. Once a region is significant for either Complete or Incomplete score, it is further classified into either Recent or Ancient scenarios (or remain unclassified if it does not reach the significance threshold). Use the Recent / Ancient tracks as references for approximate age; precise dating requires more sophisticated analysis. ,To help with the visualization we decided to combine the tracks according to the “selective sweep state” (completeness), and according to “selective sweep age”. Significance thresholds (which are genome-wide) for each one of the boosting functions are shown here:
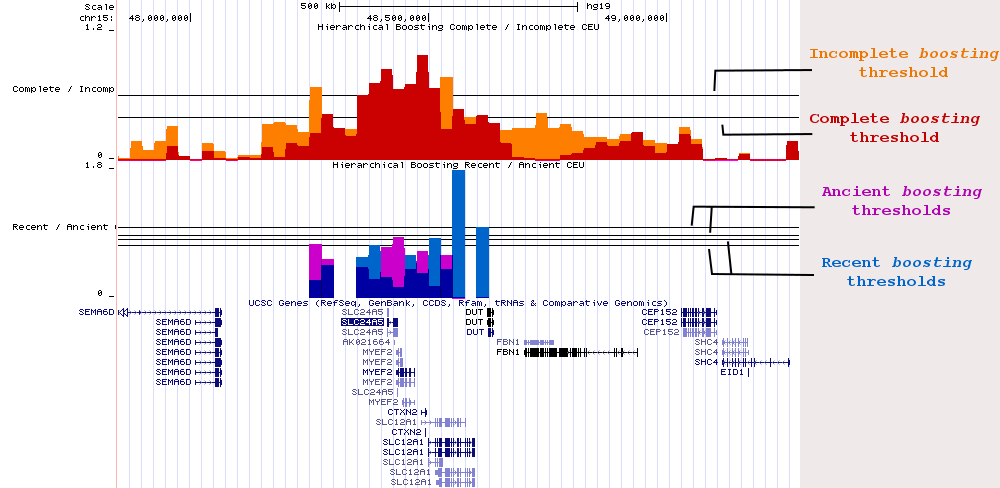
For the Complete / Incomplete tracks, the higher threshold corresponds to Incomplete scores (in orange), and the lower threshold to Complete scores (in red). For the Recent / Ancient tracks, the two upper thresholds are for Ancient scores (in violet), the lower ones are for Recent scores — either Incomplete or Complete in both cases. This threshold structure is maintained for the three populations analyzed. To know the real threshold values for each boosting function, please check the folder with the raw boosting scores here.
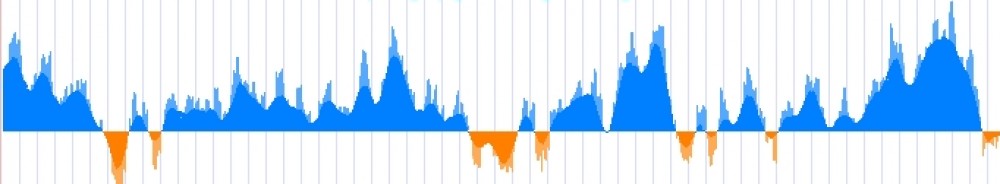
UCSC tracks are a great way to visualize features or elements in genomic regions. With selective sweeps this is more true than ever. The local properties of a given genomic region can bias the type of selection signal one would expect theoretically. One may expect that real selective sweeps are nicely defined ‘peaks’ or ‘valleys’ of scores estimated by selection test, as is usually shown in books or theoretical works: the reality is that selective sweeps resemble more to the ‘skyline’ view of a big city. Recombination landscape plays a central role here. In humans, as in most mammals, recombination rate is not constant across the genome. In fact, when one focus on the fine-scale variation in recombination rate it is easy to spot thousands of recombination ‘hotspots’ that are the main contributors to the mean recombination rate of a region. Those recombination ‘hotspots’ are usually surrounded by recombination ‘desserts’ with barely no recombination happening. It is at those recombination desserts where genetic linkage hitchhikes alleles present at the haplotype under selection, increasing or decreasing in frequency together, and generating the ‘skyline’ peaks mentioned above.
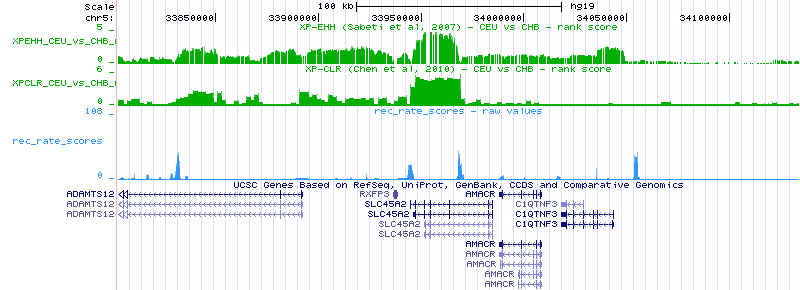
The recombination map defines the ‘shape’ and extension of a selective sweep.